4.2 Inverse Discrete Cosine Transformation (IDCT)
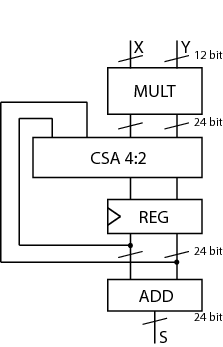
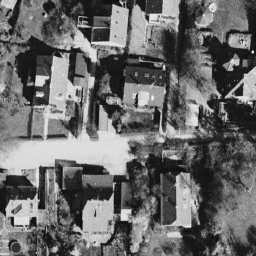
Now we combine the imprecise multiplier schemes with an error-free adder in a multiply-add (and accumulate) unit (Fig. 10) which can be used for the trivial implementation of the Inverse Discrete Cosine Transform (IDCT), which is part of the JPEG decompression algorithm.
For the unit of Fig. 10 we opted for carry-save (error-free) accumulation to keep separate the imprecision due to the multiplier and to the adder. Based on the results of software simulations, we decided not to use a sloppy adder as the extra error introduced was negligible.
We implemented the multiply unit of Fig. 10 with several variants of imprecise multipliers. Based on Fig. 8, we excluded from the IDCT evaluation radix-2 truncated multipliers (more power hungry than all others) and the sloppy-columns schemes (power dissipation savings are marginal when the error increases). In summary, we implemented the following multiply-accumulate units:


