Unpublished notes
I try documenting my findings to share with students and colleagues. Some of such notes will potentially turn into publications. If you find the material applicable to your research, contact me to hear about the publication status.
WebGL and such
Visualization is crucial when analyzing tomographic volumes, and already an initial investigation usually involves slice-wise or volumetric visualization. More interestingly, the steps of analysis pipeline and the obtained results should be visualized to support the scientific findings of the analysis.
Here I collected some notes about using WebGL for scientific visualization.
Porosity analysis
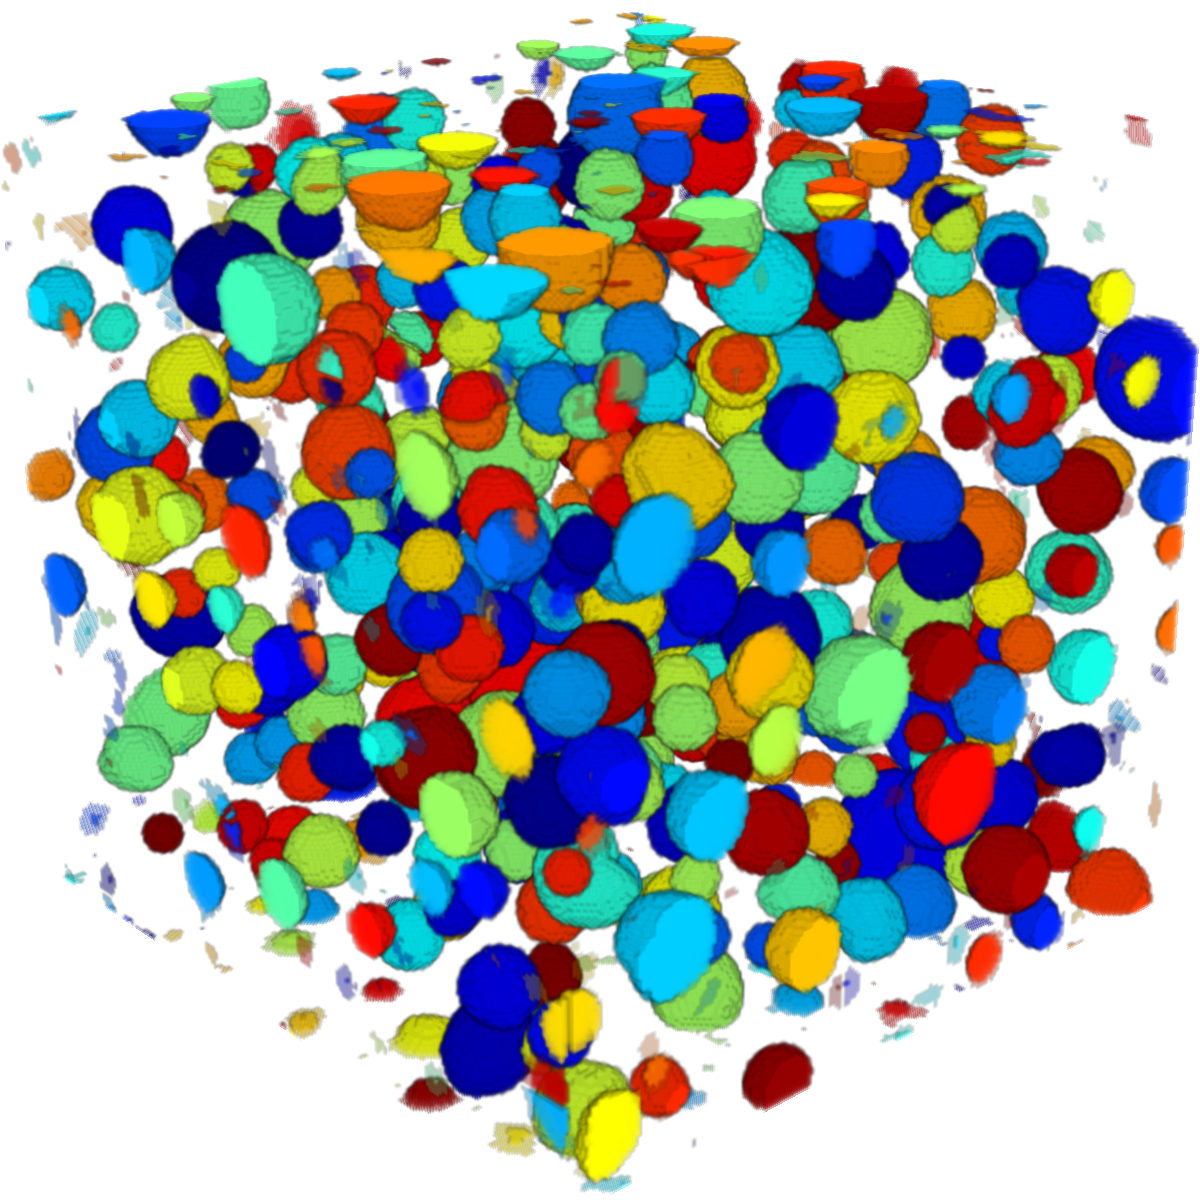
In spring 2019 I run a PhD course on porosity analysis for three PhD students from DTU Mechanical Engineering, interested in analysing porosity of 3D printed stainless steel. For this course, I developed teaching material consisting of course notes, matlab code, and example data. Contact me for access to all course material.
Orientation analysis
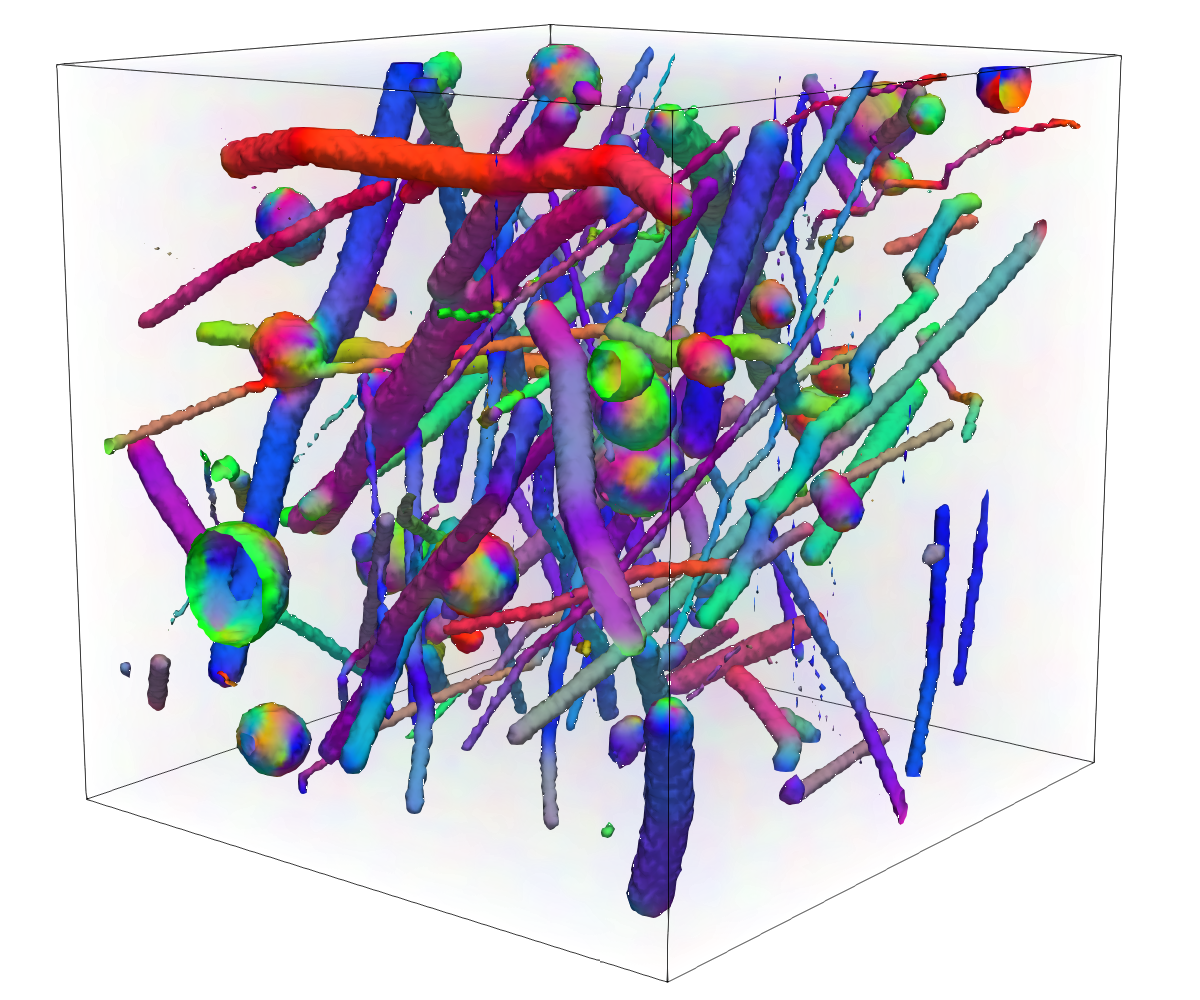
In June 2019 I shared my notes on orientation analysis with a few of my colleagues. This is ongoing work. Contact me for a more updated version, access to all material and publication status.
The notes cover the computation of structure tensor, visualization of orientation analysis and other examples of using orientation analysis in volumetric data analysis. The relation with diffusion tensor and optical flow are also covered.
3D visualization using ParaView
In 2019 I started using ParaView for 3D visualization in connection with research and teaching. Using ParaView can be rewarding -- and frustrating. Here I collect some guidelines for 3D visualization using ParaView.
Notes on ParaView are continuously updated, and so is the gallery of ParaView visualizations.